Where the Clicks Went.
Before AI, a Google search was a simple, albeit messy affair. Organic results were there as the main thing searchers wanted and valued, albeit below the surface of shopping ads, paid text ads, and later, more furniture no-one asked for. Two years ago, AI results appeared and to many, it made the mess much worse. Not that anyone was too alarmed to start with, for they appeared rarely; Google placed them on only six out of a hundred searches. But in 2025, they began to answer questions. And then Google truly loosed the reins, with AI spreading onto the comparison, brand and buying searches too. Today, sixty-one in a hundred searches carry Google's AI Overview. We'll spare the judgment on what this is doing to the wider internet and to Google's own revenues for another post. This one explains where those clicks went.
The numbers are from a new annual report on search, published at the end of October by one of the data services that sit underneath Fly Away Paul, our own research and outreach app, and plenty of other tools besides. It's built on that service's own data: 190 million keywords, 138 million AI Overview answers, 27 million ChatGPT answers and about 1.1 billion backlinks, almost all of it US and English. We've read the whole thing and put the figures that matter into the tools below, so you can turn them over yourself. Where a finding is theirs we say so, with the page it came from. Where it's our reading, for brands that sell online in particular, we say that too. The report is named and linked at the foot of this page.
The numbers at a glance
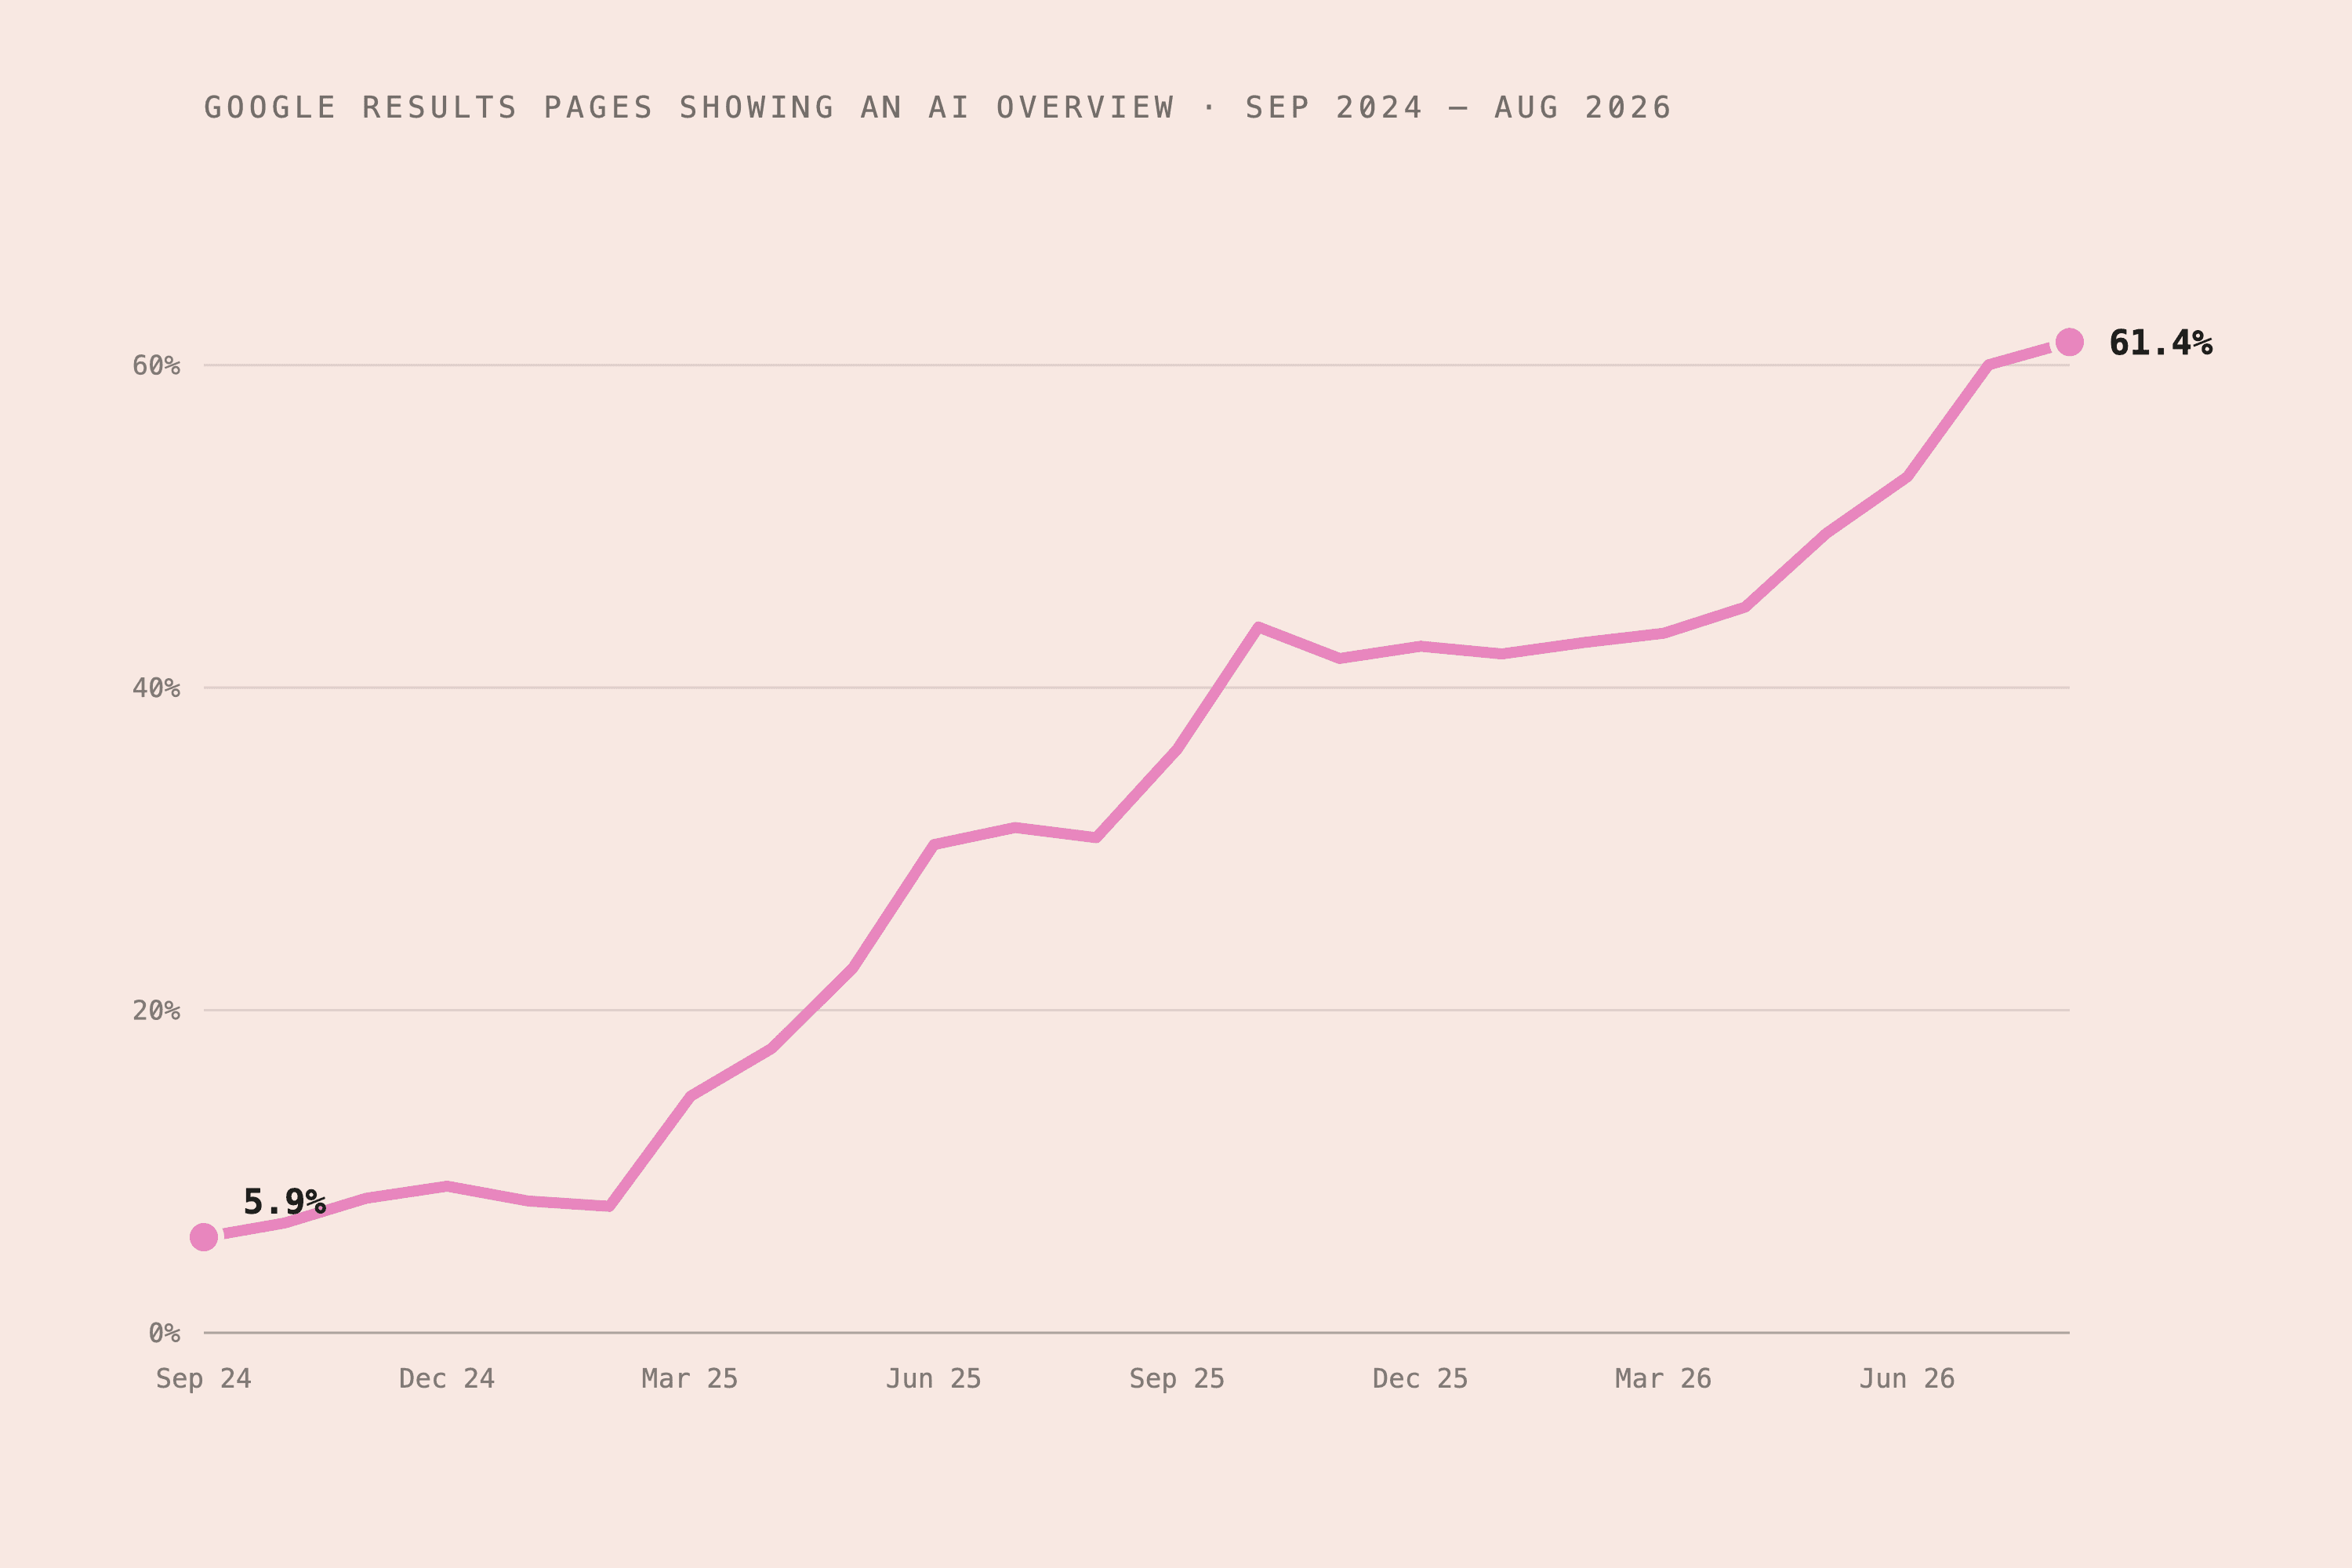
AI Overviews appear on 61.43% of Google results pages, as of August 2026, up from 5.93% in September 2024.
When one appears, the links inside it take 42–45% of the clicks. The #1 organic result falls from 33–38% of clicks to 21–24%.
Desktop click-through at #1 fell from 17.83% to 7.43% in a year, and at #2 from 15.27% to 3.07%. Mobile #1 held better, 25.17% to 20.80%.
Commercial searches trigger an AI Overview 51.35% of the time, roughly double a year earlier (26.30%). Informational searches: 70.44%.
Shops are among the least exposed industries. Apparel 37.48%, retailers and general merchandise 43.3%, home and garden 49.3%, against 56.7% for all industries.
YouTube is the site AI Overviews link to most (51.9 million links); Wikipedia leads in ChatGPT (linked from 4.88 million answers). Reddit is second in both.
Reddit appears in Google's organic top ten for 32.15% of searches, a share that's barely moved in a year.
Backlinks still correlate. Domains at #1 have 31% more referring domains at the median than positions 4–10; the report is careful not to claim cause.
One ChatGPT answer in four names no source at all (27.3%). A Google AI Overview is written on top of a search, so it nearly always links to the pages it drew from: only 0.7% carry no link.
How often do AI Overviews appear now?
On 61.43% of the results pages in the report's monthly panel, as of August 2026, from 5.93% in September 2024. It didn't climb smoothly. It stepped: to 14.67% in March 2025, to 30% that June, to 43.76% in October, and then from 45% in April this year to 60% by July. Each step is Google deciding to show the thing on another class of query, and there's no reason to think the last step was the last.
The older features went the other way. The featured snippet, the box at the top that a generation of SEO work was spent chasing, went from 8.96% of pages to 0.44%. It wasn't removed so much as absorbed: an AI Overview is a featured snippet that links to several pages instead of one. Discussions and forums fell from 21.13% to 7.42% as a block, though Reddit on its own held steady in the organic results, which we'll come to. Video results doubled, from 9.67% to 19.98%. The local pack is the one old feature that grew, from 19.98% to 25.99%.
Table view · all 24 months
| Month | AI Overviews | Local pack | Videos | Discussions & forums | Featured snippet |
|---|---|---|---|---|---|
| Sep 24 | 5.93% | 19.98% | 9.67% | 21.13% | 8.96% |
| Oct 24 | 6.81% | 20.11% | 10.78% | 23.07% | 9.52% |
| Nov 24 | 8.34% | 20.31% | 10.94% | 24.10% | 8.81% |
| Dec 24 | 9.09% | 19.89% | 10.02% | 24.93% | 7.92% |
| Jan 25 | 8.17% | 21.02% | 8.27% | 21.97% | 7.85% |
| Feb 25 | 7.84% | 21.56% | 8.06% | 14.67% | 7.45% |
| Mar 25 | 14.67% | 20.41% | 8.40% | 19.64% | 6.39% |
| Apr 25 | 17.63% | 17.51% | 6.69% | 15.61% | 5.36% |
| May 25 | 22.61% | 18.61% | 6.18% | 18.02% | 5.03% |
| Jun 25 | 30.27% | 19.40% | 6.01% | 17.56% | 4.03% |
| Jul 25 | 31.33% | 18.09% | 4.84% | 18.62% | 2.18% |
| Aug 25 | 30.70% | 20.50% | 5.85% | 16.11% | 1.92% |
| Sep 25 | 36.19% | 19.32% | 18.38% | 15.96% | 1.52% |
| Oct 25 | 43.76% | 11.47% | 31.05% | 14.36% | 1.47% |
| Nov 25 | 41.81% | 12.32% | 28.67% | 14.29% | 1.78% |
| Dec 25 | 42.57% | 16.54% | 28.35% | 13.13% | 1.70% |
| Jan 26 | 42.09% | 17.24% | 29.21% | 13.19% | 1.77% |
| Feb 26 | 42.79% | 26.76% | 25.32% | 13.11% | 1.57% |
| Mar 26 | 43.38% | 26.94% | 24.65% | 13.58% | 1.32% |
| Apr 26 | 45.00% | 25.98% | 24.93% | 17.02% | 1.04% |
| May 26 | 49.57% | 26.01% | 26.58% | 18.01% | 1.12% |
| Jun 26 | 53.08% | 26.34% | 26.27% | 11.95% | 1.06% |
| Jul 26 | 60.02% | 24.46% | 23.51% | 10.55% | 0.96% |
| Aug 26 | 61.43% | 25.99% | 19.98% | 7.42% | 0.44% |
What happens to the clicks when one appears?
This section was highly illuminating. The authors took a snapshot of results pages on 7 September 2026 and modelled, from clickstream data, where the clicks go on pages with an AI Overview and on pages without. Zero-click searches are left out, so these are shares of the clicks that still happen, not of all searches.
Without an Overview the #1 organic result takes 33–38% of the clicks, depending on intent. With one, the links inside the Overview take 42–45% and the #1 result drops to 21–24%. The loss isn't confined to the top: positions 2 to 10 lose between 36% and 42% of their combined share. And it's the same across all four intents. Whether someone is researching, comparing or ready to buy, the Overview takes roughly the same cut.
On a commercial search with 1,000 clicks to give, the #1 organic result gets about 338 of them when there’s no AI Overview and 211 when there is one. The links inside the Overview take 422. Modelled from clickstream data, not counted; zero-click searches are left out.
Table view · all four intents
| Intent | AI Overview | Organic #1 | #2 | #3 | #4–10 | #11–100 | Links inside the AI Overview | Other features & ads |
|---|---|---|---|---|---|---|---|---|
| Informational | Absent | 37.1% | 18.2% | 10.6% | 22.9% | 9.2% | — | 2.0% |
| Informational | Present | 20.7% | 10.5% | 6.2% | 13.3% | 6.5% | 42.4% | 0.4% |
| Commercial | Absent | 33.8% | 15.7% | 9.2% | 20.3% | 9.3% | — | 11.8% |
| Commercial | Present | 21.1% | 10.0% | 6.0% | 13.0% | 6.5% | 42.2% | 1.3% |
| Transactional | Absent | 37.6% | 17.1% | 10.4% | 22.3% | 9.1% | — | 3.4% |
| Transactional | Present | 21.4% | 10.2% | 6.1% | 13.0% | 5.7% | 43.0% | 0.7% |
| Navigational | Absent | 33.4% | 13.6% | 8.6% | 18.0% | 5.3% | — | 21.1% |
| Navigational | Present | 24.1% | 8.7% | 5.1% | 11.8% | 4.8% | 44.8% | 0.9% |
For a brand selling online the transactional row is the one to look at: 37.6% to 21.4% at #1, so a product page that ranks first for a buying query keeps about four clicks in seven of what it had. That isn't good. But a transactional search only shows an Overview 28.64% of the time, as the next section sets out, so across a year the blended effect on that page is well short of the headline. The informational pages are where the 70% lives.
Is organic click-through really falling?
Yes on desktop, less so on mobile, and the report is careful about why. From a panel of 2,000-odd sites' search-performance data, desktop click-through at #1 went from 17.83% in September 2025 to 7.43% in August 2026, and at #2 from 15.27% to 3.07%. Mobile #1 went from 25.17% to 20.80%, and mobile #2 rose slightly. The authors say in so many words that the data doesn't establish whether AI answers, layout changes or people's habits are driving it.
Two things to hold against the numbers. The panel bounces month to month: desktop #1 was 18.24% in November and 7.21% in April, so a single month is a reading, not a trend. And the desktop–mobile gap goes unexplained in the report. Our guess is that on a wide screen the Overview arrives open with its links in view, while on a phone it's folded and the organic results are a thumb away. A guess, and marked as one.
| Position | Desktop | Mobile | ||||
|---|---|---|---|---|---|---|
| Sep 25 | Aug 26 | Change | Sep 25 | Aug 26 | Change | |
| #1 | 17.83% | 7.43% | −10.41 pp | 25.17% | 20.80% | −4.37 pp |
| #2 | 15.27% | 3.07% | −12.20 pp | 7.99% | 8.52% | +0.53 pp |
| #3 | 3.43% | 0.58% | −2.85 pp | 5.98% | 4.77% | −1.21 pp |
| #4–10 | 1.23% | 0.60% | −0.63 pp | 3.08% | 1.93% | −1.15 pp |
Anonymised search-performance data from a panel of 2,000+ sites, filtered to 1,000+ impressions a month. Monthly values bounce: desktop #1 was 18.24% in November 2025 and 7.21% in April 2026.
Which searches trigger them?
Informational ones most, at 70.44% in the third quarter of 2026, up from 48.42% a year earlier. The bigger move is commercial queries, the "best", "vs" and "review" searches, which went from 26.30% to 51.35% over the same four quarters. Navigational doubled, from 17.04% to 34.03%. Transactional went from 10.82% to 28.64%, though that group is small in the panel and we'd treat it as the least settled line.
Share of results pages with an AI Overview, keywords with 100+ monthly searches. The transactional group is small in this panel (58,663 pages in Q3 2026 against millions for the others), so treat its line as the least settled of the four.
Table view · all four quarters
| Intent | Q4 2025 | Q1 2026 | Q2 2026 | Q3 2026 | Pages, Q3 2026 |
|---|---|---|---|---|---|
| Informational | 48.42% | 50.30% | 56.14% | 70.44% | 7,958,388 |
| Commercial | 26.30% | 29.33% | 32.94% | 51.35% | 5,635,141 |
| Navigational | 17.04% | 17.67% | 19.87% | 34.03% | 6,337,782 |
| Transactional | 10.82% | 12.13% | 14.89% | 28.64% | 58,663 |
Then the report goes looking for a corner of the keyword list the Overview hasn't reached, and doesn't find one. Terms with 201–300 searches a month trigger an Overview 58.59% of the time, more often than terms with 601 and up at 48.62%. Keyword difficulty makes little odds: 21–60 sits around 65%, 81–100 at 53.76%. Nor does what advertisers pay, with $5-plus clicks at 49.55% and the cheapest at 50.54%. There's no keyword strategy that dodges this. What varies is the kind of query, and the kind of business behind it.
Which industries are most exposed, and what about shops?
Health leads at 69.68% of results pages, then finance at 68.80%, family and community at 68.63%, consumer electronics at 67.34% and news at 65.52%. The all-industries rate is 56.7%. At the other end: real estate at 22.27%, dining at 29.37%, apparel at 37.48%, retailers and general merchandise at 43.3%, travel at 47.2% and home and garden at 49.3%.
Read that bottom list again. It's shops. The categories most of the people we build for sit in are the least exposed to AI Overviews of any in the report, and the reason is in the intent data above: Google puts an Overview on questions, and a product search is mostly not a question. Hobbies and leisure, where the frames and guitars live, sits at the average. Consumer electronics is the exception, and if you sell monitors or audio your category pages compete with an AI answer two times in three.
The links cut the other way. When an Overview does appear on a retail query, the pages it links to are few: fifteen retail sites, among the thousand that AI Overviews link to most, share 3.3 million links, eight apparel sites share half a million, and Amazon is in the overall top ten on its own. A small shop isn't going to be linked to for "running shoes". It can be linked to for the specific question only the maker can answer, which is a different page, written for a different reason.
Table view · all 23 industries
| Industry | AI Overview rate | Results pages | Links from AIOs | Domains in top 1,000 | ChatGPT answers | Domains in top 1,000 |
|---|---|---|---|---|---|---|
| Health | 69.7% | 10.4M | 22.2M | 122 | 3.27M | 62 |
| Finance | 68.8% | 4.5M | 7.7M | 50 | 2.10M | 57 |
| Family & Community | 68.6% | 7.4M | 3.6M | 34 | 0.54M | 27 |
| Computers & Consumer Electronics | 67.3% | 8.9M | 10.3M | 60 | 1.28M | 48 |
| News, Media & Publications | 65.5% | 10.1M | 39.5M | 91 | 4.40M | 109 |
| Internet & Telecom | 63.7% | 4.3M | 25.2M | 19 | 0.56M | 25 |
| Food & Groceries | 62.6% | 6.8M | 3.9M | 34 | 0.75M | 28 |
| Law & Government | 61.1% | 5.6M | 4.5M | 51 | 1.83M | 65 |
| Arts & Entertainment | 58.2% | 20.3M | 135.7M | 118 | 13.71M | 157 |
| Beauty & Personal Care | 58.1% | 4.8M | 1.2M | 11 | 0.40M | 16 |
| Business & Industrial | 57.5% | 20.8M | 24.0M | 90 | 2.42M | 82 |
| Hobbies & Leisure | 57.1% | 18.2M | 8.6M | 80 | 1.84M | 66 |
| Jobs & Education | 57.1% | 5.7M | 6.3M | 52 | 0.88M | 35 |
| Vehicles | 55.6% | 6.8M | 3.8M | 27 | 1.00M | 40 |
| Sports & Fitness | 55.0% | 9.4M | 4.2M | 37 | 1.10M | 45 |
| Occasions & Gifts | 53.9% | 3.5M | 0.4M | 8 | 0.14M | 5 |
| Unclassified | 51.0% | 16.8M | 1.5M | 9 | 0.92M | 38 |
| Home & Garden | 49.3% | 5.4M | 0.5M | 10 | 0.16M | 11 |
| Travel & Tourism | 47.2% | 8.9M | 7.7M | 53 | 1.04M | 41 |
| Retailers & General Merchandise | 43.3% | 2.1M | 3.3M | 15 | 0.64M | 13 |
| Apparel | 37.5% | 7.1M | 0.5M | 8 | 0.10M | 5 |
| Dining & Nightlife | 29.4% | 3.7M | 3.5M | 15 | 0.35M | 18 |
| Real Estate | 22.3% | 3.2M | 0.9M | 6 | 0.23M | 7 |
| All industries | 56.7% | |||||
Whose pages get the links?
On Google, video and community. YouTube is the site AI Overviews link to most, 51.9 million times, more than twice Reddit's 25.1 million; Facebook, Wikipedia and Google itself complete the top five, and six of the top ten are social, video or forum sites. ChatGPT leans the other way: Wikipedia first, linked from 4.88 million answers, Reddit second with 3.25 million, then Fandom, Britannica and the NIH. The news publishers are in ChatGPT's top thirty and absent from Google's. And 27.3% of ChatGPT answers link to nothing at all. Google's Overview is built on a search, so it almost always links to the pages it used, and only 0.7% carry no link; on ChatGPT, a quarter of the time there's no link for anyone to win, and a brand is either named in the text or it isn't.
Reddit deserves its own line. It appeared in Google's organic top ten for 32.15% of searches in the third quarter, a share that has moved less than three points in a year, with an average best position that improved from 5.41 to 5.06. The report's first recommendation follows from this: your competitors for visibility aren't only other businesses, they're the threads and videos and reference pages that get linked to for your topics, and the question is whether you're in them.
- 01youtube.com51.9M
- 02reddit.com25.1M
- 03facebook.com20.4M
- 04wikipedia.org19.9M
- 05google.com15.9M
- 06instagram.com11.9M
- 07quora.com5.8M
- 08fandom.com5.6M
- 09amazon.com5.4M
- 10tiktok.com5.2M
- 01wikipedia.org4.88M
- 02reddit.com3.25M
- 03fandom.com670K
- 04britannica.com486K
- 05nih.gov476K
- 06healthline.com369K
- 07legalclarity.org358K
- 08apple.com357K
- 09yahoo.com351K
- 10alibaba.com347K
27.3% of ChatGPT answers in the corpus link to nothing at all. Google AI Overviews are generated on top of a search, so they almost always link to the pages they drew from: only 0.7% carry no link. Reddit is second on both lists and appears in Google’s organic top ten for 32.15% of searches.
Do backlinks still matter?
They correlate, and the report is scrupulous about not saying more. Domains ranking #1 have a median of 111 referring domains against 85 for positions 4–10, a 31% gap, though the ranges overlap a great deal. Sites that AI Overviews link to for hard keywords have far bigger profiles than those linked to for easy ones: a median of 1,571 referring domains at difficulty 81–100 against 282 at 1–20. Across half a million domains, the count of referring domains correlates with how often AI Overviews link to a site at 0.41, and ChatGPT at 0.38 (Spearman's ρ), a little more strongly than links from forums and user-generated sites do, at 0.34 and 0.31. Associations, every one, and the authors say so each time.
What we take from it: the fundamentals didn't move. The site that ranked because other sites pointed at it is the site the AI answer links to. Nothing new is being asked of a backlink profile; it's being asked by one more reader.
What we'd do with it
For the brands we look after, four things, none of them dramatic.
Product and collection pages are still judged on the old things. They're the least AI-exposed pages you own, and they rank or don't on speed, structure, the words on the page and who links to you. That's most of the SEO work we do, and the report gives no reason to do it differently.
Guides and questions now compete with the Overview itself. Seven informational searches in ten show one, and it takes 42% of the clicks. The page that gets the link is the one that says the thing only the maker knows. The thin "ultimate guide" is what the Overview replaces; the maker's own knowledge is what it quotes.
Your brand lives in other people's pages now. The thread where owners of your product compare notes is a source both Google and ChatGPT reach for, and it's worth more than it was. We watch where the brands we look after turn up in AI answers through Fly Away Paul; the first time it happened to us is written up.
Don't rebuild anything on one quarter's data. The series has stepped three times in two years and will step again, and the click model is a model. Watch rankings, links from AI answers and mentions together, and move when the pattern holds for a few months rather than when a chart does.
Sources and method
Every figure above comes from Search Insider: 2026 Edition, DataForSEO's annual research report (October 2026, free to download), and each tool names the page it was read from. The data is US and English-language, except backlinks, which are global. Click shares are modelled from clickstream data on a single day's snapshot, not counted. The click-through panel is 2,000-odd sites with 1,000 or more impressions a month. Correlations are Spearman's ρ on domain-level data and show association, not cause. The tools recompute nothing; they show the report's tables. We'll revise this page when the 2027 edition lands, and if you find a number that doesn't match the source, tell us.
Google puts an Overview on questions, and a product search is mostly not a question.